In the world of data analysis and visualization, Python plays a pivotal role in conveying insights effectively. Visualizing Data (opens new window) is a core aspect where Python shines, allowing users to transform intricate datasets into easily understandable graphs and charts. This visual display helps users effortlessly understand trends and patterns.
Additionally, Python dashboards allow for interactive analysis (opens new window), giving users the ability to comprehend the data. By incorporating interactive features such as sliders, dropdowns, and buttons, individuals have the ability to dynamically adjust data, enhancing their exploration journey.
Various factors need to be considered when selecting the appropriate tool for creating Python dashboards. Every factor, from how fast development occurs to the flexibility of deployment, impacts the process of creating the dashboard as a whole. This is the point where tools such as Streamlit (opens new window) and Gradio (opens new window) come forward, providing specific features designed for various requirements.
As we start this exploration of Streamlit and Gradio, it is crucial to grasp their abilities in developing effective Python dashboards that meet various user needs.
# Diving Into Streamlit: Features and Benefits
Streamlit is a cutting-edge, open-source Python library designed to streamline the creation of interactive and visually compelling data applications. Its intuitive interface makes it accessible even to those with minimal front-end experience. This tool is particularly popular among data scientists and machine learning practitioners because it allows for the rapid transformation of data scripts into dynamic dashboards.
When paired with MyScale (opens new window), a high-performance vector database, Streamlit’s capabilities are further amplified. MyScale ensures that even as datasets grow in complexity, data retrieval remains swift and accurate, making it an excellent choice for applications that demand both speed and scalability. Furthermore, MSTG (Multi-Scale Tree Graph), a proprietary algorithm by MyScale, optimizes filtered vector search by structuring data hierarchically. This integration enhances retrieval efficiency, handling large and complex datasets with ease.
- Quick Dashboards Creation
One of the standout features of Streamlit is its ability to facilitate rapid dashboard creation. Developers can turn Python scripts into interactive web applications with just a few lines of code. This approach not only accelerates the prototyping process but also reduces the time required to bring a dashboard from concept to deployment.
- Advanced Customization
Beyond its quick setup, Streamlit provides advanced customization options, allowing developers to tailor dashboards to their specific needs. Whether it’s customizing the user interface or refining data visualizations, Streamlit offers the flexibility to build tailored, engaging dashboards that meet project requirements.
# Code Example
To illustrate the simplicity and effectiveness of Streamlit, here's a basic example that creates a simple dashboard:
import streamlit as st
import pandas as pd
import numpy as np

# Title of the dashboard
st.title('Simple Data Dashboard')

# Create a sample dataframe
df = pd.DataFrame({
    'Column A': np.random.randn(100),
    'Column B': np.random.randn(100),
    'Column C': np.random.randn(100)
})

# Display the dataframe
st.write("Here's a sample dataframe:", df)

# Add a line chart
st.line_chart(df)
Here’s what this code looks like in action:
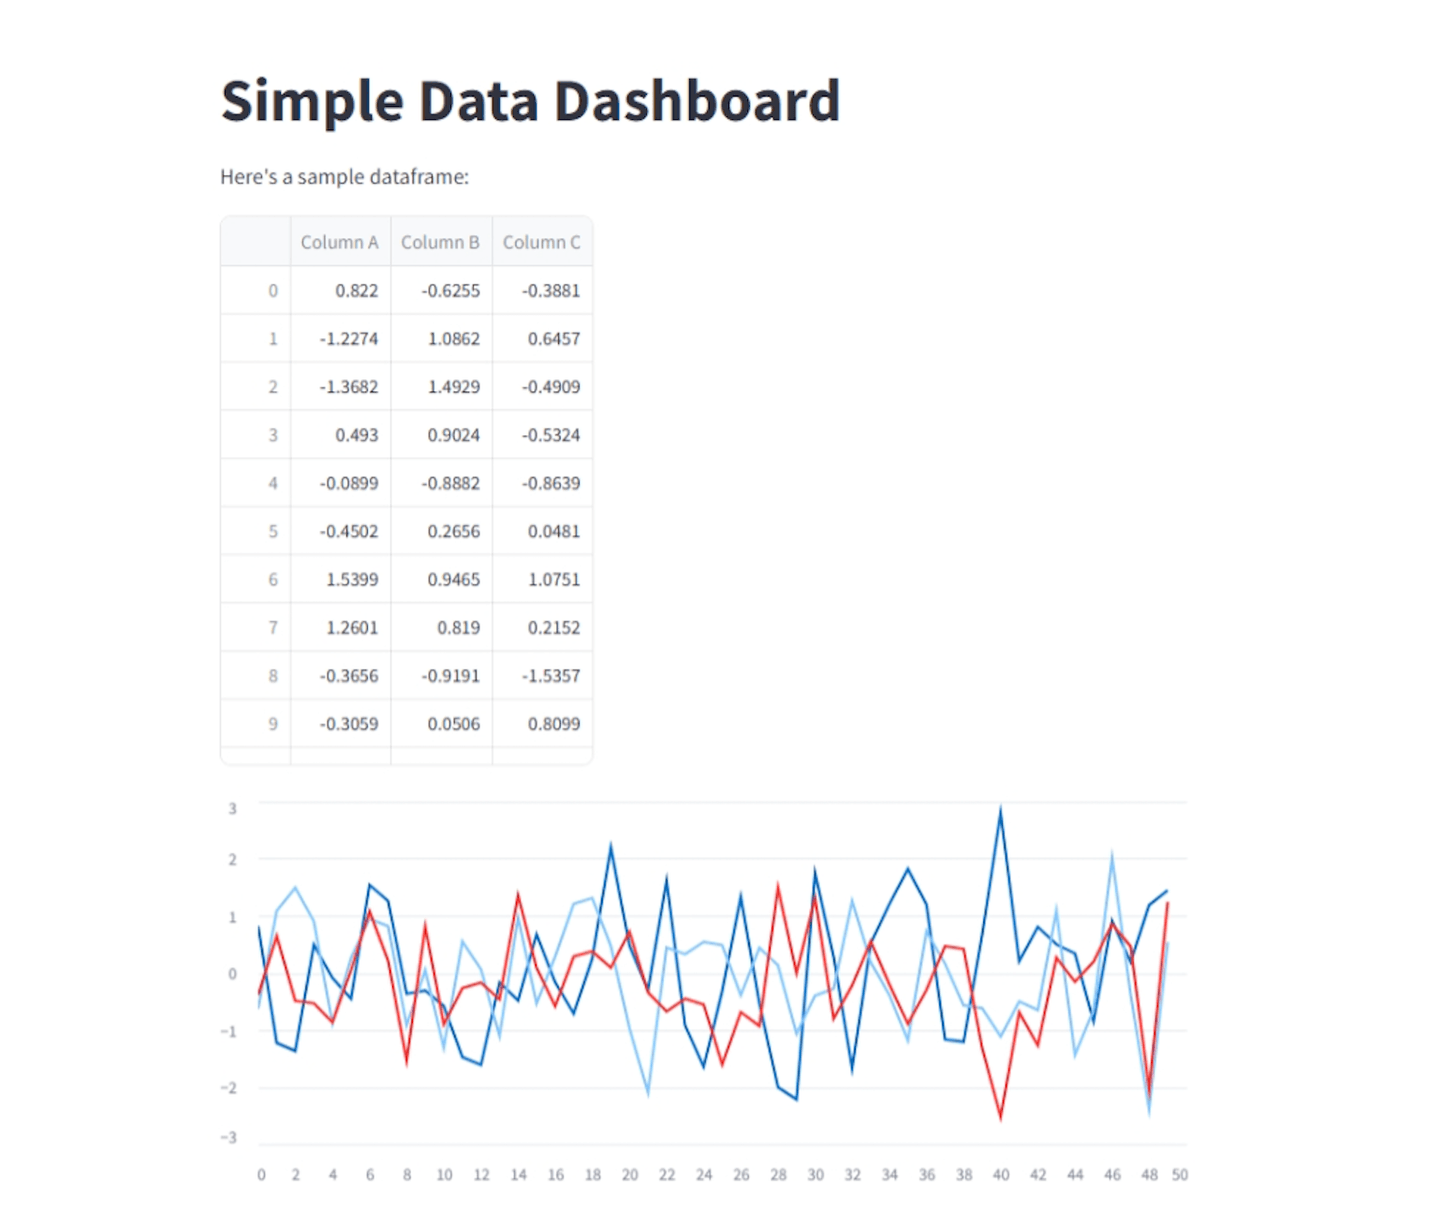
This example demonstrates how Streamlit can quickly generate an interactive dashboard that displays a sample dataframe and a line chart. With just a few lines of code, Streamlit makes it easy to create a functional and visually appealing application.
# Why Choose Streamlit?
Streamlit excels in several key areas for dashboard creation:
- User Management: It provides efficient user management capabilities, allowing developers to set access levels and permissions easily.
- Deployment: Streamlit’s straightforward deployment process simplifies sharing applications, whether on a local server or the cloud.
- Community and Support: The Streamlit community is another strong asset. With an active forum of developers and a wealth of resources—including tutorials, examples, and documentation—Streamlit users benefit from extensive support. This vibrant community fosters collaboration and knowledge sharing, enhancing the overall development experience.
# Exploring Gradio: What Sets It Apart
Gradio is an innovative, open-source Python library designed to create user-friendly interfaces for machine learning models and data applications. Its primary focus is on simplifying the process of transforming machine learning models into interactive web applications that can be easily used and understood by a broad audience. Gradio’s intuitive interface makes it accessible for both technical and non-technical users.
When combined with MyScale’s vector database capabilities, Gradio's ability to interface with complex machine learning models is further enhanced. MyScale ensures that the data underlying these models is retrieved and processed efficiently, providing a seamless user experience even when working with large and dynamic datasets.
# Ease of Use
One of Gradio's most notable features is its emphasis on ease of use. It allows users to build interactive interfaces for machine learning models with minimal effort. By providing a simple API, Gradio enables developers to quickly create web-based applications that showcase model predictions and interact with various inputs.
# Quick Deployment
Gradio is designed to facilitate rapid deployment of machine learning models. It supports seamless integration with existing frameworks and offers options for deploying applications as standalone servers or REST APIs. This flexibility ensures that models can be shared and accessed easily by users, regardless of their technical background.
# Code Example
To highlight Gradio’s simplicity and effectiveness, here’s a basic example that sets up a simple interface for a machine learning model:
import gradio as gr

# Define a simple function for the model
def add_numbers(a, b):
    return a + b

# Create a Gradio interface with updated syntax
interface = gr.Interface(
    fn=add_numbers,
    inputs=[gr.Number(label="Number A"), gr.Number(label="Number B")],
    outputs="number",
    title="Simple Addition Model",
    description="Enter two numbers to get their sum."
)

# Launch the interface
interface.launch()
Here’s how this code appears in action:
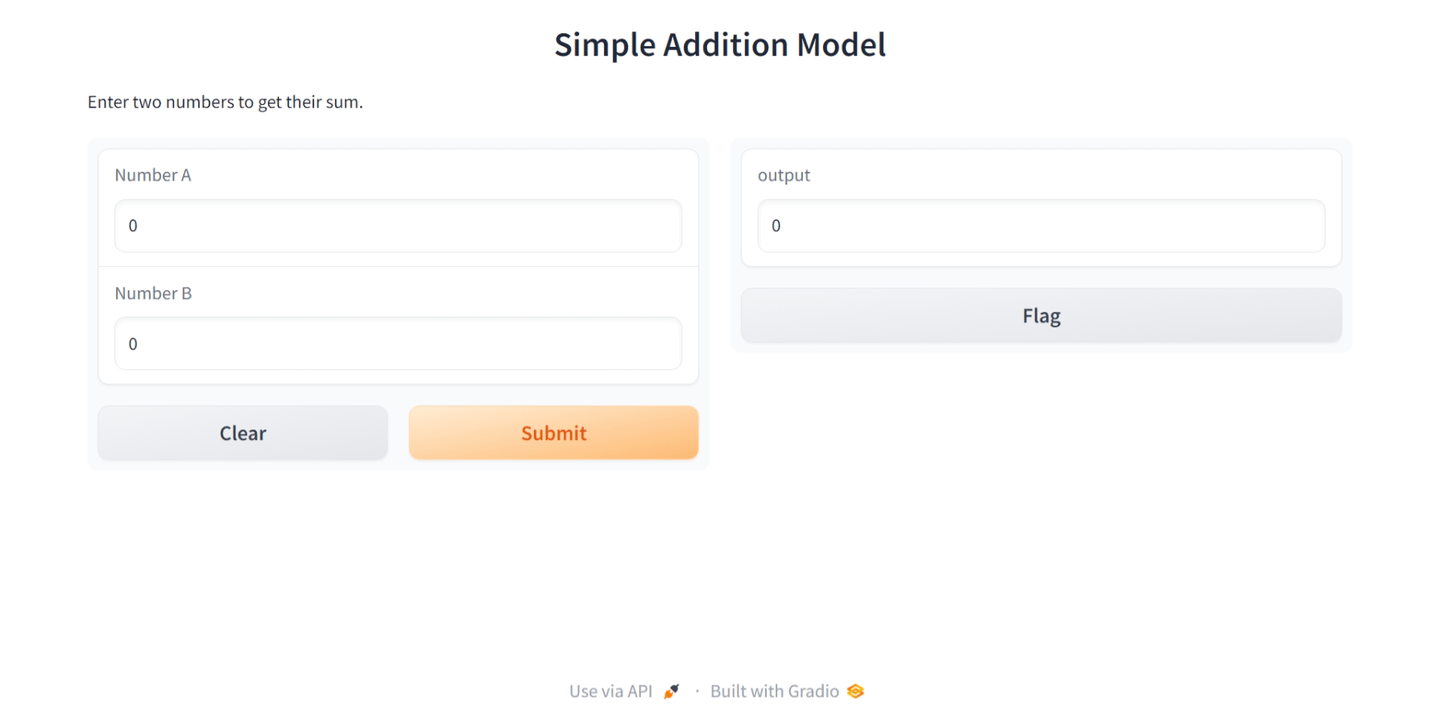
In this example, Gradio is used to create a basic web interface for a simple addition function. Users can input two numbers and see the result instantly. This straightforward example demonstrates Gradio’s ability to quickly set up interactive applications with minimal code.
# Why Choose Gradio?
Gradio stands out in several areas:
- Interface for Machine Learning Models: It is specifically designed to provide intuitive interfaces for machine learning models, making it easier for users to interact with and understand model predictions.
- Quick Deployment: Gradio’s rapid deployment capabilities allow models to be shared and accessed via standalone servers or REST APIs, facilitating easy integration into various workflows.
# Community and Support
Gradio boasts a supportive community and extensive resources. The active community offers tutorials, examples, and forums where users can seek help and share insights. This network of support helps users get the most out of Gradio’s features and ensures a collaborative environment for learning and development.
# Streamlit vs Gradio: A Detailed Comparison
Here's a comparison table summarizing the key aspects of Streamlit and Gradio:
| Aspect | Streamlit | Gradio |
|---|---|---|
| Ease of Use | More advanced with a steeper learning curve; offers extensive customization options. | Intuitive and straightforward; quick to set up and easy for beginners. |
| Learning Curve | Requires time to master its advanced features and customization capabilities. | Easier to pick up due to its simplified interface and focus on rapid development. |
| Deployment | Supports deployment with community support and extensive documentation; real-time updates. | Flexible deployment options; real-time updates with simpler setup. |
| Visual Appeal | Focuses on creating visually engaging and interactive dashboards with extensive customization. | Emphasizes simplicity; visual customization is more limited compared to Streamlit. |
| Integration Options | Suitable for projects requiring advanced customization and complex integrations. | Ideal for simpler, interactive applications with quicker development cycles. |
| Available Resources | Large support base, detailed documentation, and extensive examples available. | Good documentation but a smaller support base compared to Streamlit. |
| User Base | Larger community presence with a diverse pool of expertise and active collaboration. | Smaller user base; growing but not as extensive as Streamlit’s community. |
This table provides a quick overview of the strengths and considerations for both Streamlit and Gradio, helping you decide which tool best suits your project's needs.

# Assessing Your Needs
Choosing between Gradio and Streamlit depends on your project's specific needs. Evaluate factors like deployment flexibility, customization options, and ease of use. Gradio is ideal for rapid development and user-friendly interfaces, making it suitable for quick prototyping and simpler applications. Streamlit excels in advanced customization and interactive dashboards, making it better for complex projects requiring detailed customization and strong community support.
When integrating these tools with MyScale, consider how MyScale’s high-performance vector database can enhance data handling and retrieval. MyScale ensures efficient data operations, making it a valuable addition for applications with large and dynamic datasets.
Consider future scalability when making your decision. Both tools offer unique advantages, so understanding your long-term project goals, including how MyScale can support your data needs, will help you choose the right solution.